|
|
|
|||
|
Seismic
Sequence Analysis As explained in the introduction to the web site, sequence stratigraphy is used to subdivide the sedimentary section into geometric packages bounded unconformities and internal surfaces, and infer the relationship of these geometries to changes in base level (sea level and tectonic movement) and rates of sedimentation. These inferences and sequence stratigraphic analyses are often based on seismic cross-sections, well logs and outcrop studies of sedimentary rocks and are used to predict the continuity and extent of their lithology. Usually seismic provides the regional control on the geometries of sequences and wells are used to determine the lithology of these geometries. To achieve this latter a tie must be made between local wells and local seismic. Thus the purpose of the exercise below is to introduce the common method for tying the local stratigraphy of a region to seismic cross-sections that dissect it. HOW
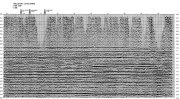
A SYNTHETIC SEISMIC TRACE IS GENERATED Using
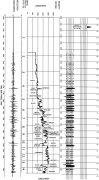
this velocity information and density data supplied, geophysicists
generated a velocity log that
1) Expresses the vertical measurements made at the well as two way travel time. 2) Calculated the vertical variation in the reflection coefficients from one acoustic layer to another.
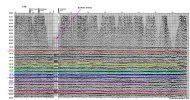
3) A zero phase, normal polarity Ricker wavelet, was convolved with the reflection coefficients to produce the synthetic seismic trace beside the two way travel time log model for the Zablonty #1. 4) Finally the geophysicists, consulting with geologists, established the vertical position of the stratigraphic tops penetrated by the Zablotny #1. THE EXERCISE The seismic line used in this exercise was provided by the Gulf Oil Company and was interpreted in the two publications by Lindsay, and Kendall l985, and Rafavich, Kendall, & Todd l984.
For the
exercise use colored pencils to mark the location of the tops
of the Green Horn Formation, Piper Lime Formation, Spearfish
Formation, Amsden Formation, Base of Last Salt, Mission Canyon
Formation, Duperow Formation, Red River Formation, Winnepeg
Formation, Deadwood Formation and Basement on the synthetic.
The final step in the exercise should be to write up a short analysis describing the steps you have taken and the conclusions you made based on your interpretation of the seismic line and the regional geology. SOLUTION
RELEVANT
LINKS For more information on impedance, reflection coefficients and synthetic seismic review the Schumberger Oil Field Glossary) and Acoustic Impedance. Kansas Geological Survey, Open File Report 96-50 provides more details on synthetics and tying of wells to seismic data. University of Southern Ontario provides good introduction to Synthetics and Seismic Interpretaion. The Ocean Drilling Program (ODP) provides excellent section on Seismic Stratigraphy and Synthetics. The Geophysical Corner of AAPG EXPLORER has a good section on various geophysical concepts. (this is an example link to principles of VSP). ESIinfo basic geophysical terminology. West Virginia University Fault/Horizon Interpretation Using Kingdom Suite (SMT). Geogia Tech Seismic Resources on the World Wide Web Seismic wave theory in the US: 1991--1994: Jeffrey Park from Yale University/Department of Geology and Geophysics provides a good review of seismic wave theory complete with references. CREWES (The Consortium For Research in Elastic Wave Exploration Seismology) provides excellent bried introduction of wave conversion with outstanding graphics for clarifying concepts. UCSC - Relating Boreholes or Outcrops to Seismic Data: Synthetic Seismograms and Other Tools. This is an excellent introduction to creating synthetics with many images illustrating the various tools and obtained images. University of Lausanne page that deals with Teaching seismic interpretation provides introduction to reflection seismology and 3D seismic survey concepts. Colorado School of Mines Reservoir Characterization Project/Chapter on Surface Seismic Calibration deals with how synthetic seismograms are created and how they can be utilized for seismic interpretation. Kansas Geological Survey section on Seismic records and the synthetic seismogram provides clear steps needed to compute synthetic seismograms using sonic logs. REFERENCES |
|||