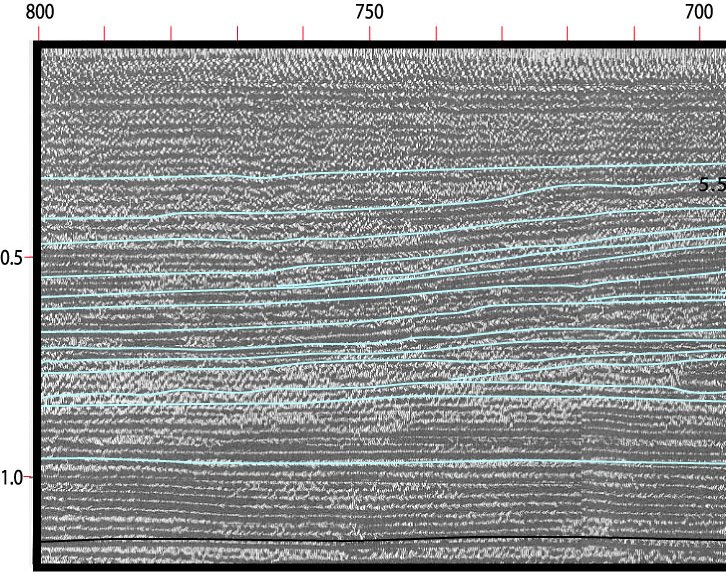
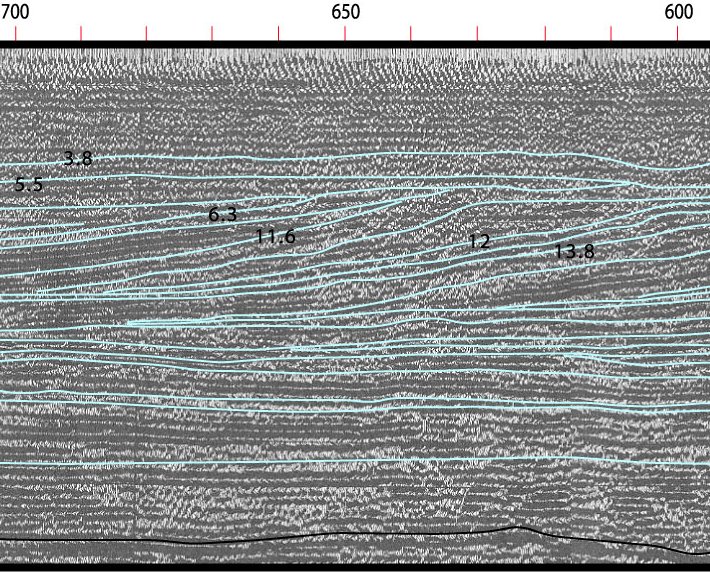
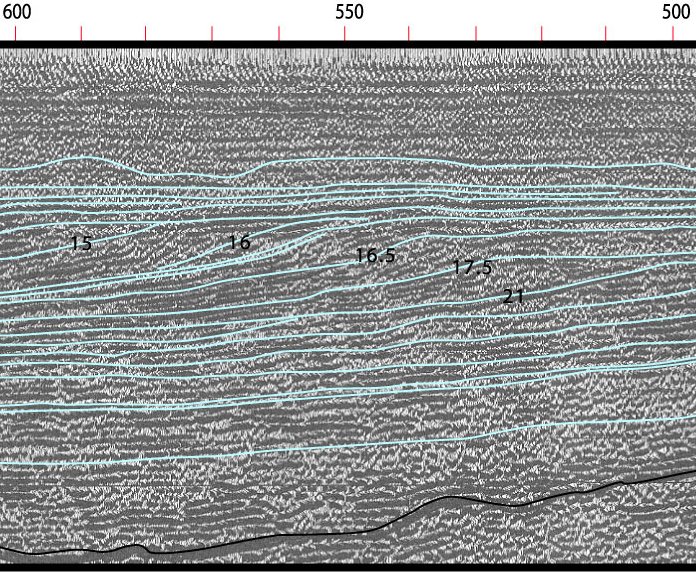
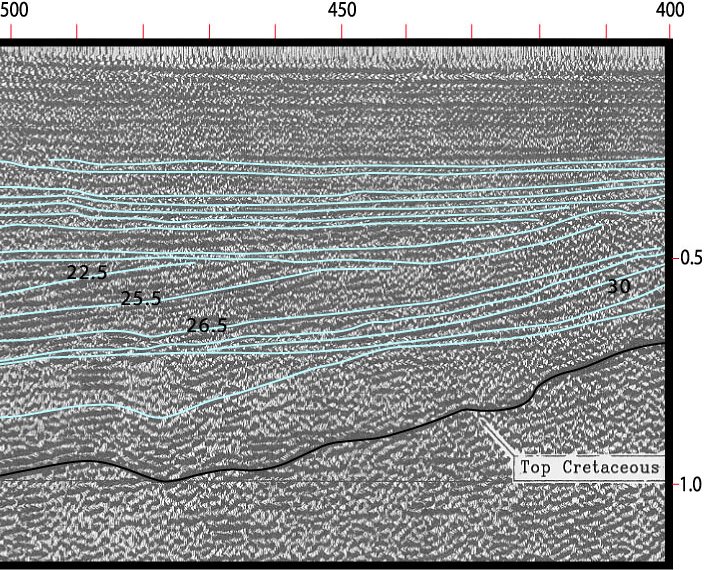
|  
             Seismic 
              Sequence Analsis 
              Final Report, Solutions  
            DISCUSSION 
                
              The laterally stacked sequences of a seismic section are the product 
              of tectonic movement and carbonate accumulation and also of sea 
              level 
              changes whose signal can be identified by making sequence stratigraphic 
              interpretations (Vail et al., 1988). As Eberli 
              et al (1994) indicated, a sedimentary 
              simulation   
              can successfully reproduce the geometries seen on a seismic line. 
              The seismic data that documents the sedimentary fill of the Straits 
              of Andros exhibits a series of onlapping and downlapping edges with 
              various angles of slope. It would appear that different basin depths 
              affected the timing and extent of progradation. They also show that 
              there was a close balance between aggradation and progradation, 
              and that small changes in the rate of relative sea level movement 
              and/or carbonate accumulation rates caused immediate switches from 
              aggradation to progradation in the margin. Progradation took place 
              after the space that existed on the upper slope had been reduced 
              and the sediment-transported offbank was able to fill the remaining 
              space downslope so extending the platform margin farther basinward. 
              In particular, progradation was triggered by sea level drops that 
              shifted sediment production and accumulation to the margin slope. 
              Carbonate production rates similar to modern rates were required 
              to produce the sediment necessary for progradation, which suggests 
              that carbonate production has been consistently high since the early 
              Tertiary. At the same time repeated exposure and erosion have reduced 
              the overall preservation and decreased the overall accumulation 
              rate. Progradation occurred in pulses which are recorded on the 
              seismic 
              lines and are confirmed by the simulation 
              to be a succession of prograding and sigmoidal sequences, with each 
              sigmoid clinoform apparently having formed as a result of a single 
              cycle of sea level fall and rise (Eberli and Ginsburg, 1989). 
               
              Each prograding sequence was up to 500 m thick and probably consisted 
              of an offlapping complex of reefal carbonates covered by calcareous 
              sand. Eberli and Ginsburg (1989) thought that during the transgressive 
              stages, marginal reefs were established and then buried during the 
              subsequent highstand, when abundant sediment was produced on the 
              flooded bank. Their interpretation was based on findings from the 
              leeside of the modern bank where early Holocene reefs are covered 
              by offbank transported sand (Hine et al., 1981). 
            The two 
              1990 core borings on the western margin of the Great Bahamas Bank 
              have confirmed this interpretation. Interestingly, the seismic section 
              suggests progradation of the bank margin continued at sea level 
              lows even though the platform was exposed. It would appear that 
              either in situ accumulation remained high at sea level lows or that 
              the platform sediments were eroded. For a carbonate shelf setting 
              with a low rate of subsidence and a high rate of sedimentation, 
              very clear stratigraphic signals should be produced by eustatic 
              sea level changes. This requires that the rate of carbonate sedimentation 
              be such that the accommodation was filled to sea level, suggesting 
              that the sediment surface on the shelf can be taken as a proxy of 
              this sea level. For such a case, when 1) the rates of subsidence 
              and carbonate accumulation were constant during several sea level 
              cycle; and 2) there was a match in the frequency and amplitude of 
              the onlapping geometries of seismic and simulation, then it can 
              be assumed that the frequency and amplitude of eustatic events of 
              the input curve, the corrected Neogene 
              Curve (NC) used for this study, is close to reality. This match 
              in the seismic and the simulation geometries established that ustatic 
              sea level charts can be used to date seismic sequence boundaries, 
              as was the case of the Neogene carbonate platform of the of Straits 
              of Andros in Bahamas. It also shows that the sea level curve can 
              be used to test seismic interpretations and update the ages of sequence 
              boundaries when biostratigraphic data is poor. Try to match your 
              interpretation with results of ODP leg 166 Preliminary reports. 
               
            The ages 
              of the OPD SSBs are based on biomarker species horizons and the 
              use of interpolated sedimentation rates between them. One might 
              argue that the mismatch is because the the 
              Haq et chartal chart is inaccurate or that some events are not 
              as global as was thought. On the other hand the mismatch may be 
              produced by a tectonic signal mixed with a global sea level signal, 
              producing leads and lags in the formation of sequence boundaries. 
              However, the fact is that your interpretation and the other from 
              ODP, should match closely, and in this case this is a compelling 
              argument for this kind of interpretation for dating similar sections 
              where biostratigraphy is poor. 
			  Click 
                    here for a solution and match the output with your interpretation. 
                    For a fuller description of this solution, click on Eberli 
                    et al (1994), Kendall 
                    et al (1998), and Sen 
                    and Kendall (1999). 
                  To 
                    gain access to the complete image containing the interpreted 
                    seismic section of the exercise, click on the appropriate 
                    image to download it in a series of images (each divided image 
                    can be printed on a regular 11" X 8.5" paper).  
                   Complete 
                    seismic section (about 40" wide). 


             |