 To gain access to the Adobe pdf file containing the un-interpreted seismic sections of the exercise, click the appropriate image to download them. Images can viewed on a PC, Notebook, Tablet, or Pad and interpreted with Power Point. Using Power Point drawing tools, in particular curve, is an effective and easy way to handle the objectives of the exercise and a means for collective viewing of results in class. Click on red box for more details. The output can be
 printed, reassembled and taped (PRINTABLE-EX-1). You can also print the image. Whether you use electronic media or paper follow the procedures outlined below to interpret the seismic.
Color PDF files : (12-81 - 12a-81 - 16-81a -16-81b - 26-74 - 27-81a - 27-81b - 37-81a - 37-81b)
B/W PDF files: (12-81 - 12a-81 - 16-81a -16-81b - 26-74 - 27-81a - 27-81b - 37-81a - 37-81b)
Once the 2D seismic data is downloaded it will be seen that most of the lines are divided in two. These pairs of lines can be taped or pasted together, e.g.: 12-81 & 12a-81; 16-81a & 16-81b; 27-81a & 27-81b; and 37-81a & 37-81b. Note that 26-74 is complete! Thus this data set can be considered to consist of five intersecting lines which can be cross-tied and interpreted.
Below a number of objectives for this exercise are listed. Start with 1) and work through 2) to 4). Problem 3) may be considered as a dangerous call, but without tight biostratigraphic data the use of the Sea Level chart may be a best first pass as a tool for dating the stratigraphic section!!!
1) Determine the sequence stratigraphy of each of the lines and the clinoformed sequences that form the Lower Cretaceous sedimentary section by:
a. Identifying the termination of seismic reflectors at discontinuity surfaces.
b. Establishing which of these surfaces form the sequence boundaries
c. Numbering the sequence boundaries (there are around 21 or so).
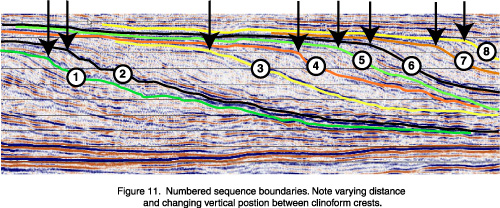
d. Outlining and labeling the geom/p>
f The sequences (the Nanushuk Group and Torok Formation clinoforms) and the systems tracts they enclose (Figure 11).
e. Correlate sequence boundaries from line to line; tie these at the cross lines.
2) Next map and study the sedimentary architecture of the clinoforms and infer the origins of these features. For instance do the clinoform geometries show evidence of delta switching, slumping and migration related to the shifting of the source areas in the SW? Was there a variable rate of sediment supply to the area of study? Is there evidence of widespread changes in base level? To answer these:
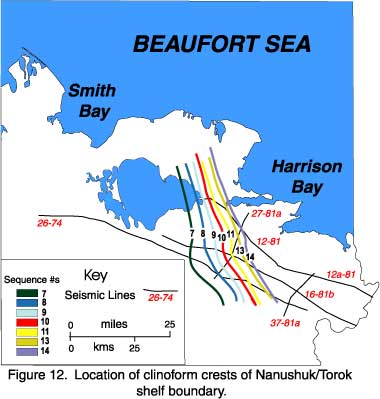
a. First map the location of the crests of the distinct clinoformed margins (Figures 11 & 12).
b. Map the varying thickness and widths of the clinoforms from one or two sequences (isochron maps) and make overlay maps of the distribution of the systems tracts.
c. What is the cause of the clinoforms? High rates of sedimentation relative to lower rates of subsidence and periodic changes in base level, or point source switching? If point source migration were responsible, would it be possible to correlate the same clinoforms to different lines?
d. Establish if the maps suggest parallel progradation of the coastal margin or show evidence of delta migration?
e. Determine the direction of progradation or delta migration?
f. Identify downslope slumps (Figure 10) and see if they can be tied from line to line for any specific relative times. Is there evidence that they were produced during changes in base level?
g. Identify and locate basin floor fans, and slope fans (Figure 10). Is there evidence that they were produced during changes in base level?
h. Identify and locate onlapping wedges of sediment (Figure 07). Is there evidence that they were produced during changes in base level?
i. Identify the crests of clinoformed margins that have been eroded or truncated and see if they can be tied from line to line so relating them to specific time intervals (Figure 07). Is there evidence that they were produced during changes in base level?
j. Do the major eroded clinoform margins (i.e. basin crests) match the downslope slumps, and associated basin floor fans, and slope fans? If they do, how do you explain this relationship?
3) As indicated above poor biostratigraphic contol means it is difficult to determine the ages of the individual clinoforms, never the less Palmer (1983) and Bird and Molenaar (1991) have been able to infer that the eastern most part margin of the progradational Torok Formation and Nanushuk Group are Cenomanian in age. The Haq and others (1987) chart for the Cenomanian/Albian has nine major changes in sea level, at least three of which might be expected to produce major second order type 1 unconformities. There were marked sea level lows, particularly the major type 1 unconformities and associated lows at 112 my, 109 my, 107.5 my, 98 my, 96 my and 94 my, that suggest these may have been large enough to produce erosional events at the crests of the clinoforms displayed by the seismic sections. Below the exercise proposes examination of the erosional events on the seismic sections to see if these events can be tied to the changes in base level predicted on the Haq and others (1987) chart. If this can be done, is it possible to establish their relative timing? Is there a match between the onlapping and downlapping geometries of the clinoformed section and the Haq et al 1987 sea level curves:
a. Identify and count the 2nd and 3rd order "type one" unconformities and their related sequence boundaries on the seismic lines.
b. Generate chronostratigraphic charts for each of the lines to separate and analyze the changes in base level responsible for the sequences. The chronostratigraphic charts can be created by using a spread sheet on which the widths each of the numbered sequences is recorded and then display these widths as a chronostratigraphic chart
c. Can these be matched to a number of the 2nd and 3rd order events on the Haq et al 1987 sea level chart?
4) The tectonic setting of the Collville Basin is that of a foreland basin. Changes in local base level related to local changes tectonic behavior would be expected to produce local changes in accommodation. To this end the internal geometries of the clinoforms should be examined to see if a presence or an absence of small-scale tectonic control on the area can be detected.
Similarly there was an overwhelming sediment supply from the folded and thrust Brooks Range to the South, a deepening in the foreland basin to the SW suggesting regional tectonic subsidence with the development of extensive accommodation, while there was reduced accommodation and thinning over on the adjacent Cratonic fragment to the NE over the Barrow Arch.
To examine the magnitude of these tectonic effects measure the thickness of the updip Nannushuk shelf
a. Are there any local variations in the thickness of onlapping shelf sediments that could be ascribed to a local tectonic signal?
b. Could a local tectonic signal have produced any of the downslope slumping?
c. Are there any regional variations in the thickness of onlapping shelf sediments or downslope downlapping sediments that could be ascribed to a regional tectonic signal? Are these in phase with the 2nd and 3rd order events on the Haq et al 1987 sea level chart or are these separate events?
d. Is any evidence of a regional tilt to the sedimentary fill penecontemperaneous with its deposition or is it post deposition?
Click on the image designated as linked to the solution and match the output with your interpretation. For a fuller description of this solution, click on the link to the Final Report on this exercise.