|
The
Permian Basin Exercises
Introduction
The
purpose of this group of exercises is to use a mix of well
logs, seismic, and outcrop data to interpret carbonate sections
using data from the Permian Basin of West Texas and New Mexico.
The column to the right has thumbnail images that provide
links to .pdf files that can be downloaded
to a printer to execute the various exercises associated with
Permian Basin and to images that provide some of the background
information needed to help interpret the well logs and the
seismic section. The basic model used in these exercises is
the Harris & Saller, (1999) interpretation.
The Permian carbonate
shelf and reef margin complex of West Texas and New Mexico
of the Delaware Basin which outcrop in the Guadalupe Mountains
have been the target of extensive exploration for hydrocarbons.
A mix core, well log sections, field observations and seismic
have established that the eclectic depositional facies of
this region cover a wide range of settings which have responded
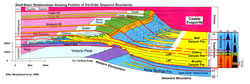
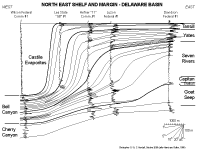
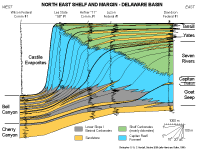
to changing sea level and carbonate productivity. The figure
below by Beuabouef et al, (1999) captures some of the diversity
of this carbonate margin as it evolved. So during late Leonardian
time the Northwest shelf of the Delaware Basin consisted of
a relatively low angle prograding fine grained shelf to ramp
to basin transition that included the updip Victorio Peak
and the down dip Bone Spring Limestone. During Gudalupian
time the earlier Leonardian high stand system tract carbonate
sediments were overlain by, incised into and onlapped by the
low stand Brushy and basal Cherry Canyon of largely deeper
water clastic sandstones that downdip form basin floor fan
complexes. Up dip the time equivalent sedimentary system was
the low relief prograding San Andres carbonate ramp. Through
the rest of Guadalupian time sedimentary section captures
the beat of varying sea level with clastics by passing and
capping the carbonate margins during sea level lows while
the carbonate bank systems progressively thickened and steepened
as they stepped seaward during the seal level highs.
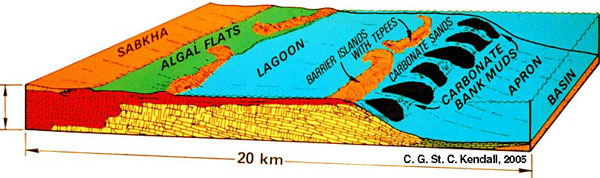
Northwest
shelf of the Delaware Basin (Beuabouef et al, 1999)
|

Guadalupe Mountains

Delaware Basin Hydrocarbon
Plays

Oil Fields of Permian
Basin

Sea
Level Change
Ex-01
Uninterpreted

Well
Locations
|
Exercise
1
Task and Data Sets
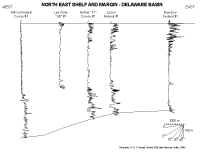
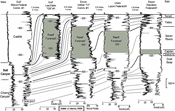
Down load the un-interpreted well log section (Ex-01) from Texas
that disects the North Eastern margin of the Delaware basin. The
map locating this well log section is provided. Use a mix of your
understanding of the Permian Basin from the panoramic view of the
basin and the cross section drawn by Beaubouef et al (1999) and
the well log section exercise to build an interpretive geological
model.
To build this interpretive model your first task is to correlate
the character of the Gamma
Ray well logs from well to well. As with the earlier exercises
associated with the Syldavian
Basin, you should see if you can establish patterns of coarsening
or fining upward cycles and link them from well to well. Draw arrows
on the exercise print out to indicate the grain size variation and
so mark patterns of shoaling or deepening upward in character. As
before an arrow inclined to the left would indicate that the grain
size is coarser and that the water became shallower while an arrow
that is inclined to the right would indicate that the grain size
is finer and so the water became deeper.
You will
probably find that to use of these well logs alone to correlate
between the sections is confusing. I contend that it would be hard
for even the most experienced geologist and sequence stratigraphers
to correlate the well logs. The reason for the ambiguity in the
character of these well logs is that carbonates in the section have
an extremely variable character and are interbedded with both clastics
and in some cases with evaporites both down and up dip. Also in
addition to having varying lithofacies the carbonates of this section
have tended to have become cemented and/or leached thus changing
their petro-fabrics and obscuring signals that might used to indicate
grain size change as they do in clastic rocks. The way round this
problem is to aid the interpretation of this section through the
calibration of well log character with the seismic section that
parallels the well log section.
Exercise
2
Task and Data Sets
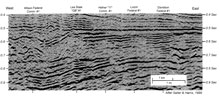
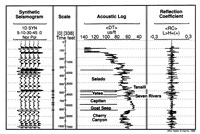
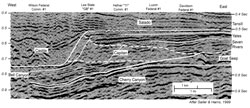
First down load the un-interpreted seismic section that parallels
the well log section (Ex-02-Seis UnInt) and the synthetic seismic
trace for the Davidson Federal #1 well that has the major stratigraphic
units penetrated by this well identified on it (Synthetic).
Examine the synthetic and look for similarities between the
reflector characters and that of the seismic section at the
location of the Davidson Federal #1 well. Where these reflectors
coincide with major stratigraphic tops like that between the
Salado Formation and underlying Tansill Formation or between
the Tansill Formation and the underlying Yates Formation, etc.,
these should be indicated on the seismic cross section and traced
regionally across this line. Now
download the partly interpreted well log section from Texas
across the North Eastern margin of the Delaware basin (Permian-Ex-02).
Use your interpretation of the seismic line mixed with an
understanding of the Permian Basin from the panoramic view
of the basin and the cross section drawn by Beaubouef et al
(1999) and this well log section build an interpretive model.
Again your task is to correlate the character of the Gamma
Ray well logs from well to well establishing the patterns
of coarsening or fining upward cycles and linking them from
well to well. As before an arrow inclined to the left would
indicate that the grain size is coarser and that the water
became shallower while an arrow that is inclined to the right
would indicate that the grain size is finer and so the water
became deeper. Using the calibration of well log character
with the seismic section that parallels the well log section
should make this task somewhat easier and the information
gathered this way is getting closer to that needed to make
a sequences stratigraphic analysis from which it should be
possible to predict the geometry and extent of carbonate lithofacies.
|
|
Exercise
3
Task and Data Sets
First down load the interpreted seismic section that parallels
the well log section (Permian-Ex-02-SeisInt) on which the major
stratigraphic tops are indicated on the seismic cross section
and traced regionally. Now download the more completely interpreted
well log section from Texas across the North Eastern margin
of the Delaware basin (Permian-Ex-03). Use the interpretation
of the seismic line mixed with your understanding of the Permian
Basin from the panoramic view of the basin and the cross section
drawn by Beaubouef et al 1999 and this well log section to build
an interpretive model. Again your task is to correlate the character
of the Gamma Ray well logs from well to well establishing the
patterns of coarsening or fining upward cycles and linking them
from well to well. As before an arrow inclined to the left would
indicate that the grain size is coarser and that the water became
shallower while an arrow that is inclined to the right would
indicate that the grain size is finer and so the water became
deeper.
|
Interpreted
Seismic Line
Ex-03 More
completely Interpreted X-Section
The
Solution to Ex-03
|
Using the
calibration of well log character with the interpreted seismic section
that parallels the well log section should make this task somewhat
easier and the information gathered this way is getting closer to
that needed to make a sequences stratigraphic analysis from which
it should be possible to predict the geometry and extent of carbonate
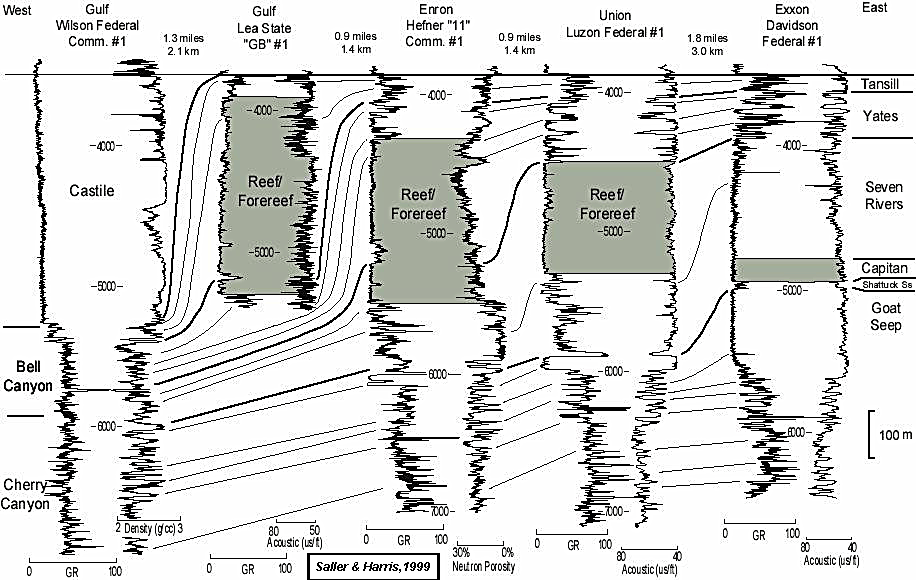
lithofacies. To the completely interpreted well log section from
Texas across the North Eastern margin of the Delaware basin link
to Permian-Ex-03 Solution. This later solution would be improved
if you were able to use a combination of cores and logs.
Interpretation
of Well log Section with wider range of logs
Permian
Basin References cited above
Beaubouef, R. T., C. Rossen, F. B. Zelt, M. D. Sullivan, D. C. Mohrig,
and D. C. Jennette, 1999, Field guide for AAPG Hedberg Field Research
Conference: deep-water sandstones, Brushy Canyon Formation, West
Texas, April 15-20, 1999, Tulsa, Ok, AAPG, p. 99.
Borer, J.M., and Harris,
P.M., 1991, Lithofacies and cyclicity of the Yates Formation, Permian
Basin: implications for reservoir heterogeneity: American Association
of Petroleum Geologists Bulletin, v. 75, p. 726-779.
Harris, P.M., and Saller,
A.H., 1999, Subsurface expression of the Capitan depositional system
and implications for hydrocarbon reservoirs, northeastern Delaware
Basin, in Saller, A.H., Harris, P.M., Kirkland, B.L., and Mazzullo,
S.J., eds., Geologic Framework of the Capitan Reef: Tulsa, OK, SEPM
Special Publication No. 65, p. 37-49.
Ward, R.F., KendallL,
C.G.St.C., and Harris, P.M., 1986, Upper Permian (Guadalupian) facies
and their association with hydrocarbons ‹ Permian basin, west
Texas and New Mexico: American Association of Petroleum Geologists
Bulletin, v. 70, p. 239-262.
Link to
Nassir Alnaji's Bibiography
for Permian Basin and Arabian Peninsula
Link to
Peter Scholle's Bibliography
for Permian Basin and the Guadalupe Mountains
|