THE EXERCISE
The objective of this exercise is to tie the geology expressed in a synthetic seismic trace generated from wells to the seismic lines they penetrate and establish what the age and lithofacies of the sedimentary section traversed by the seismic section is. The stratigraphy of the region is captured from the wells penetrating this section of the Williston basin and linking these to the seismic cross-sections that dissect it. This geology of this area is thus established by tying geologic character of the lithofacies and age from a well that penetrated the seismic section by creating a synthetic seismic trace generated from the velocity and density logs of the well.
The seismic line traverses the Little Knife Oil Field in the Williston basin where the Zablotny #1 well was drilled by Gulf Oil (Rafavich, Kendall, and Todd, l984). Your task is to take a well (the Zablotny #1) drilled in the Little Knife Oil Field in the Williston basin and tie this to a North South seismic line across this field. To achieve the latter a synthetic seismic trace had be generated for the Zablotny #1. The seismic line used in this exercise was provided by the Gulf Oil Company is associated with the Maddison limestone. The seismic line used in this exercise was provided by the Gulf Oil Company and was interpreted in the two publications by Lindsay, and Kendall l985, and Rafavich, Kendall, & Todd l984.
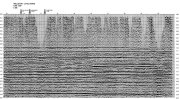
To gain access to the un-interpreted seismic section click on the image to left to download it or print it (click here  for a smaller version of same section). You can either print the image or transfer it directly to a PC, Notebook, Tablet, or Pad and using drawing tools, including Power Point, follow the procedures outlined in the introduction to interpret this. First identify the termination of seismic reflectors on the seismic cross section at discontinuity surfaces; then establish which of these surfaces form the sequence boundary. Follow this by demarking the geometries of the sequences and the systems tracts the sequence encloses.
The next step is tie the partially interpreted seismic to the well log by using the synthetic log trace and following the procedures outlined below.
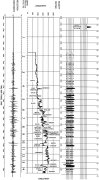
First access the synthetic trace image, click on the images to left to print it or download it to a PC, Notebook, Tablet, or Pad.
For the exercise use drawing tools that include Power Point or for the hard copy and colored pencils to mark the location of the tops of the Green Horn Formation, Piper Lime Formation, Spearfish Formation, Amsden Formation, Base of Last Salt, Mission Canyon Formation, Duperow Formation, Red River Formation, Winnepeg Formation, Deadwood Formation and Basement on the synthetic.
If working with a paper copy of the synthetic it size should be reduced by 58% and the paper copy of the synthetic trace should be folded at the seismic trace and this should be overlain on the seismic line at the location of the Zablotny #1 well. The same techniques should be used with electronic media. Mark the various tops on the seismic, correlate and color these so they can be traced across the seismic line. List the formation names of the tops where they intersect the edges of the seismic line.
The final step in the exercise should be to write up a short analysis describing the steps you have taken and the conclusions you made based on your interpretation of the seismic line and the regional geology.
SOLUTION
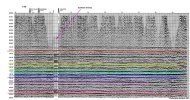
To gain access to the interpreted seismic section and match it with your interpretation click on the image to left to download it or print it (click here for a smaller version of same section).
SOME RELEVANT LINKS
For more information on impedance, reflection coefficients and synthetic seismic review the Schumberger Oil Field Glossary) and Acoustic Impedance.
Kansas Geological Survey, Open File Report 96-50 provides more details on synthetics and tying of wells to seismic data.
The Ocean Drilling Program (ODP) provides excellent section on Seismic stratigraphy and Synthetics.
The Geophysical Corner of AAPG EXPLORER has a good section on various geophysical concepts. (this is an example link to principles of VSP).
West Virginia University Fault/Horizon Interpretation Using Kingdom Suite (SMT).
Seismic wave theory in the US: 1991--1994: Jeffrey Park from Yale University/Department of Geology and Geophysics provides a good review of seismic wave theory complete with references.
CREWES (The Consortium For Research in Elastic Wave Exploration Seismology) provides excellent brief introduction of wave conversion with outstanding graphics for clarifying concepts.
University of Lausanne page that deals with Teaching seismic interpretation provides introduction to reflection seismology and 3D seismic survey concepts.
Colorado School of Mines Reservoir Characterization Project/Chapter on Surface Seismic Calibration deals with how synthetic seismograms are created and how they can be utilized for seismic interpretation.
Kansas Geological Survey section on Seismic records and the synthetic seismogram provides clear steps needed to compute synthetic seismograms using sonic logs.
REFERENCES
l985 Lindsay, R.F., and C.G.St.C.Kendall, Depositional facies, diagenesis, and reservoir character of Mississippian cyclic carbonates in the Mission Canyon Formation, Little Knife Field, Williston Basin, North Dakota: in P.O. Roehl and P.W. Choquette eds. Carbonate petroleum reservoirs: Springer Verlag New York, p. l75-l90.
l984 Rafavich, F., C.G.St.C.Kendall, and T.P. Todd, The relationship between acoustic properties and the petrographic character of carbonate Rocks: Geophysics, v. 49, p. l622-l636