Figure 16: Synthetic seismograms and SP logs
for four wells on the south-to-north cross section in Figures 11 and 12. Use
these data to tie surfaces to the SP logs. Transfer your interpreted seismic
reflectors from Figure 16 to the wells in the wireline-log cross section
(Figure 14).
Figure 17: Interpreted south-to-north
oriented wireline-log cross section (Figure 14) paralleling the seismic line in
Figure 15. Wells 2-6 were correlated to the seismic data with synthetic
seismograms (Figure 16). Note cycles Z, A, B, and C, and the variable
wireline-log character of the parasequences. Facies-association interpretations
are based on core data.
3. Interpret and color the systems tracts on the seismic line and wireline-log cross section. One interpretation is given in Figures 17 and 18.
Key Surfaces Manifested in Core
Sequence
boundaries (lowstand-surfaces of erosion) and flooding surfaces
(transgressive-surfaces of erosion) are identifiable from core data. Clues to
their presence are the nature of bed contacts between two lithofacies (e.g.,
erosional), the juxtaposition of two non-genetically related,mappable facies
associations (i.e., a facies association is missing, making Walther’s Law is
invalid), and contrasting biofacies, ichnofacies, and/or diagenesis between two
superimposed beds (Harris et al., 1984; Kidwell, 1984; Pemberton et al., 1992;
and Ketzer et al., 2002). Contrasting lithofacies across the unconformity
(i.e., bedding surface) is common, but not always present. Sandstone-sandstone
and shale-shale contacts are in places, unconformable.
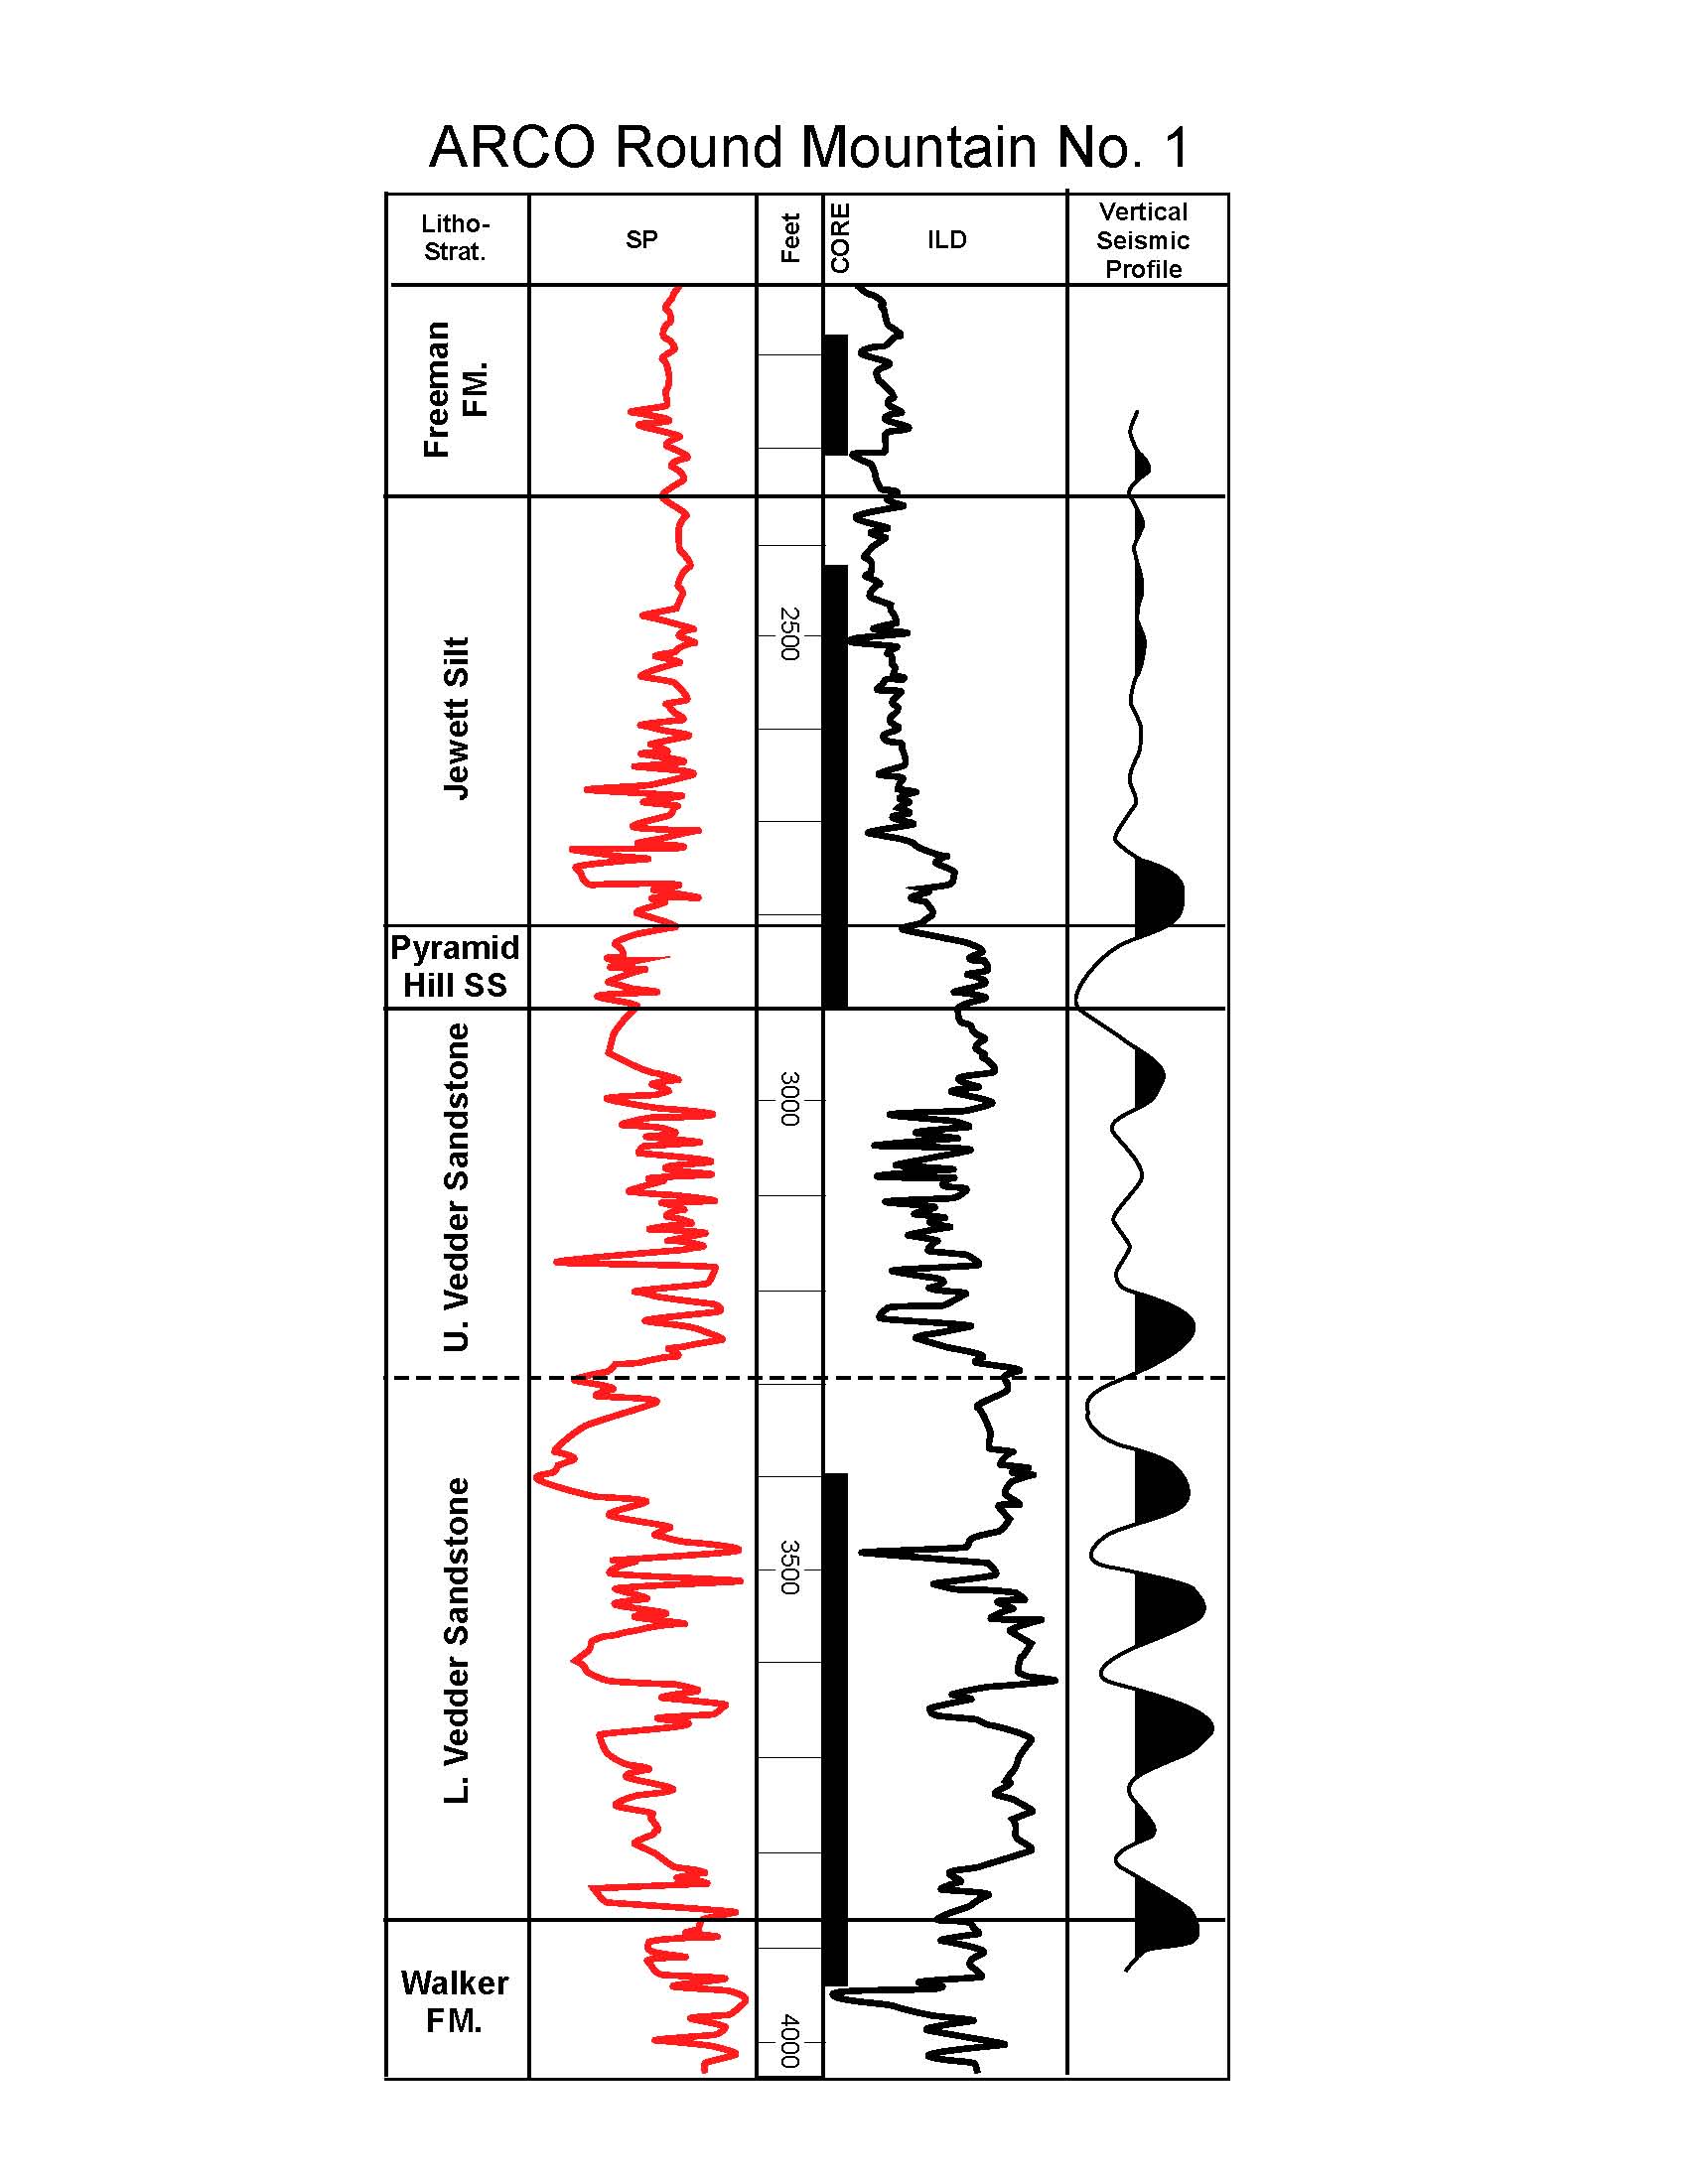
The
ARCO Round Mountain No. 1 well (Figures 1 and 19) was drilled to investigate
the facies content of Oligocene-age, seismically identified and mapped systems
tracts (Hewlett et al., 2014) and the character of their bounding surfaces. 318
meters of core were cut from the Lower Vedder Sandstone, Jewett Silt, and
Freeman Silt (Figure 19). Wireline logs and a vertical-seismic profile provide
a good tie between the core and seismic data. Thus, seismic reflections, the
lithofacies represented by them, and the geologic character of
lowstand-surfaces of erosion and transgressive-surfaces of erosion were
observed in core. Peruse the wireline logs, core profiles, and photographs in
Figures 20-22with the intent to identify key stratigraphic breaks (i.e.,
surfaces) that may record significant allocyclic events in the basin’s history.
Facies descriptions and a key to core-description symbols are in Tye et al.
(1993). Again, Van Wagoner et al. (1990), Posamentier and Allen (1999),and Blum
and Törnqvist (2000) lend good advice and
examples in carrying out this interpretive process.
