Vedder/Jewett Sands

 
Exercise 2: Ramp-Margin Setting– Oligocene Vedder/Jewett Sands
 

Log Correlations:

Review the Vedder Sand stacking patterns and interpreted facies associations on the cross section (Figure 14). Follow the steps outlined below to make your stratigraphic interpretation.

  1. Concentrate on the upper Vedder Formation sands (highlighted in yellow) and Freeman Silt. The cross section is flattened on a log marker near the top of the Vedder Formation. Displayed logs are SP and Resistivity;
  2. Choose and correlate markers between the datum and section base to divide the interval into mappable parasequences and parasequence sets;
  3. Identify upward-coarsening and upward-fining parasequences noting their lateral changes(thin,thicken,lithology);
  4. Characterize the vertical stacking pattern(s) of parasequences as progradational, aggradational, or retrogradational.
Images in the data set in this exercise section and for the earlier exercise section can be printed or imported into electronic media that include PC, Notebook, Tablet, or Pad. Using Power Point drawing tools in the electronic media is an effective and easy way to handle the objectives of the exercise and a means for collective viewing of results in class. Click on red box for more details in a separate tab.


Figure 14: South-to-north oriented wireline-log section for the correlation of parasequences in the Vedder Formation. See Figure 1 for location.


Seismic Correlations

1. Interpret the seismic section (Figure 15) by focusing on the interval near well #4, above and below reflections “A” and “B”. Follow the steps outlined in Exercise 1.

  1. Mark terminations of seismic reflections (i.e. black = peak =positive reflection coefficient);
  2. Note the lateral continuity of reflections (i.e., Z, A, B, etc.);
  3. Recognize and correlate:
          a. Reflection terminations (e.g.., downlap, toplap, erosional trucation);
          b. Regional onlap surfaces;
          c. Seismic downlap surfaces;
          d. Truncation surfaces;
          e. Erosional, incised-valley fills 
 
Follow the methodologies discussed in Mitchum et al. (1977), Van Wagoner et al. (1990), and Posamentier and Allen (1999), as you pick reflection terminations, trace the surfaces using a yellow pencil. Interpret stratigraphic-stacking patterns and systems tracts.
 
Figure 15: South-to-north oriented seismic section for the correlation of reflections and interpretation of systems tracts in the Vedder Formation. See Figure 1 for location.
 

2. Characterize the reflection-stacking patterns

a. Draw a vertically exaggerated (compressed) sketch of reflection geometries and their terminations;

     b. Note progradational, aggradational, and retrogradational stacking patterns;

     c. Color systems tracts on both your sketch, and the seismic line;

   i. Highstand systems tract - light blue

   ii.Transgressive systems tract - light green

   iii.Lowstand systems tractorange.

d. Using synthetic seismic ties to the four wells shown Figures 15 and 16, transfer the seismically-based correlations (reflections Z, A, B etc.) onto the wireline-log section (Figure 14) and compare the seismic interpretation to the wireline-log based correlations.

 
 Figure 16: Synthetic seismograms and SP logs for four wells on the south-to-north cross section in Figures 11 and 12. Use these data to tie surfaces to the SP logs. Transfer your interpreted seismic reflectors from Figure 16 to the wells in the wireline-log cross section (Figure 14). 


Figure 17: Interpreted south-to-north oriented wireline-log cross section (Figure 14) paralleling the seismic line in Figure 15. Wells 2-6 were correlated to the seismic data with synthetic seismograms (Figure 16). Note cycles Z, A, B, and C, and the variable wireline-log character of the parasequences. Facies-association interpretations are based on core data.
 
3. Interpret and color the systems tracts on the seismic line and wireline-log cross section. One interpretation is given in Figures 17 and 18. 
 
 
Figure 18: Seismically interpreted stratal geometries and terminations, key stratigraphic surfaces, and systems tracts on the south-to-north seismic line shown in Figure 15.


Key Surfaces Manifested in Core

Sequence boundaries (lowstand-surfaces of erosion) and flooding surfaces (transgressive-surfaces of erosion) are identifiable from core data. Clues to their presence are the nature of bed contacts between two lithofacies (e.g., erosional), the juxtaposition of two non-genetically related,mappable facies associations (i.e., a facies association is missing, making Walther’s Law is invalid), and contrasting biofacies, ichnofacies, and/or diagenesis between two superimposed beds (Harris et al., 1984; Kidwell, 1984; Pemberton et al., 1992; and Ketzer et al., 2002). Contrasting lithofacies across the unconformity (i.e., bedding surface) is common, but not always present. Sandstone-sandstone and shale-shale contacts are in places, unconformable.
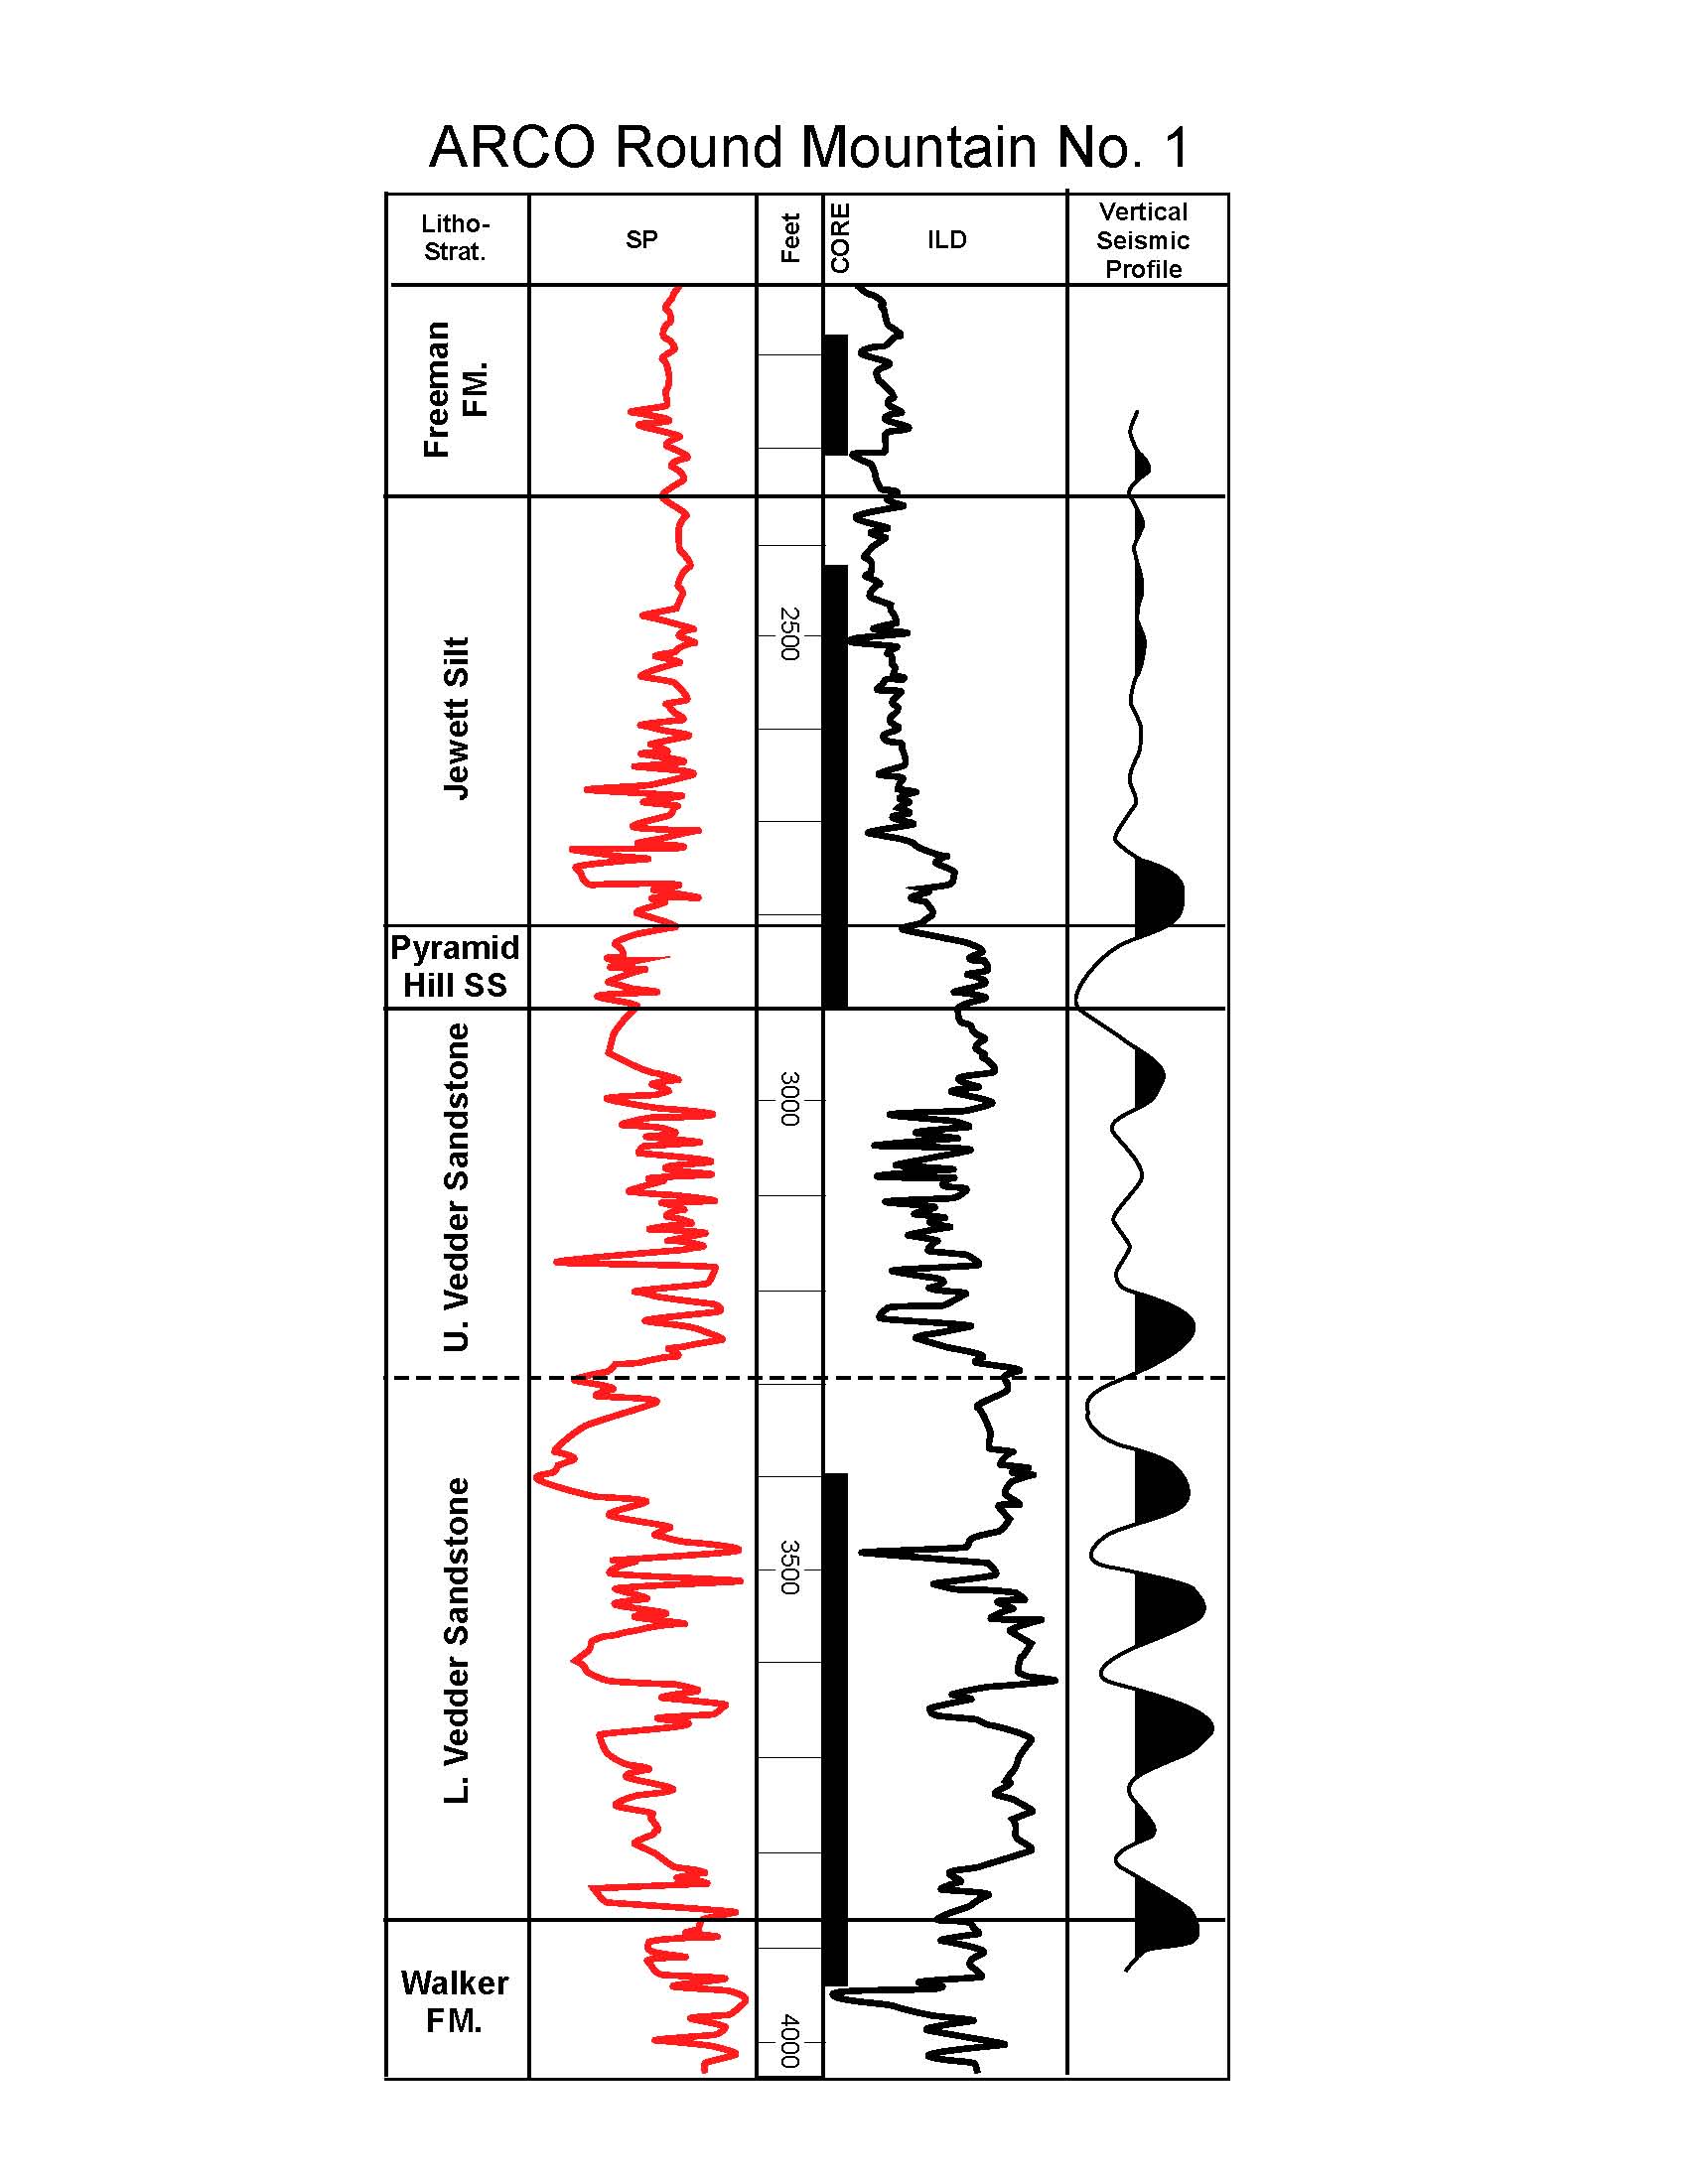
The ARCO Round Mountain No. 1 well (Figures 1 and 19) was drilled to investigate the facies content of Oligocene-age, seismically identified and mapped systems tracts (Hewlett et al., 2014) and the character of their bounding surfaces. 318 meters of core were cut from the Lower Vedder Sandstone, Jewett Silt, and Freeman Silt (Figure 19). Wireline logs and a vertical-seismic profile provide a good tie between the core and seismic data. Thus, seismic reflections, the lithofacies represented by them, and the geologic character of lowstand-surfaces of erosion and transgressive-surfaces of erosion were observed in core. Peruse the wireline logs, core profiles, and photographs in Figures 20-22with the intent to identify key stratigraphic breaks (i.e., surfaces) that may record significant allocyclic events in the basin’s history. Facies descriptions and a key to core-description symbols are in Tye et al. (1993). Again, Van Wagoner et al. (1990), Posamentier and Allen (1999),and Blum and Törnqvist (2000) lend good advice and examples in carrying out this interpretive process.


Figure 19:Wireline-log (SP and ILD), cored intervals, and a vertical-seismic profile from the ARCO Round Mountain No. 1 well.


 Figure 20:Cored and logged section of the ARCO Round Mountain No. 1 well across the upper Walker and Vedder Sand contact. Use the wireline and core (vertical profile and photographs) data to interpret surfaces of possible sequence-stratigraphic significance. The grain size scale ranges from clay to pebble size. See Tye et al. (1993) for additional information. 


 Figure 21:Cored and logged section of the ARCO Round Mountain No. 1 well through the Vedder Sand (Z interval). Use the wireline and core (vertical profile and photographs) data to interpret surfaces of possible sequence-stratigraphic significance. The grain size scale ranges from clay to pebble size. See Tye et al. (1993) for additional information.


Figure 22: Cored and logged section of the ARCO Round Mountain No. 1 well through the Vedder Sand (A interval). Use the wireline and core (vertical profile and photographs) data to interpret surfaces of possible sequence-stratigraphic significance. The grain size scale ranges from clay to pebble size. See Tye et al. (1993) for additional information.


Figures 20-22 illustrate stratigraphic sections containing a sequence boundary, flooding surfaces, and channel diastems. The defining criterion for each includes:

i. Sequence boundary (lowstand-surface of erosion): alluvial strata erosionally overlain by shelf deposits (Figure 23);

ii. Marine-flooding surface (transgressive-surface of erosion): shelf strata erosionally overlying alluvial and shallow-marine facies associations (Figures 23-24); and

iii. Channel diastems: alluvial strata erosionally overlying estuarine, shallow-marine, and shelf facies associations (Figures 23 and 24).

Channel diastems interpreted in Figures 20 and 21 may represent locally restricted bedding contacts (i.e., channel bases). However, if a channel diastem identified in core can be tied to wireline and seismic data, and mapped regionally, it may constitute a sequence boundary.

Figure 23: Interpreted stratigraphic surfaces and facies associations in the cored and logged section of the ARCO Round Mountain No. 1 well across the upper Walker and Vedder Sand contact. Note that shelfal deposits overlie weathered volcanic and alluvial deposits (Walker Fm.) and the lowermost Vedder formation sand. Marine-flooding surfaces (i.e., transgressive-surfaces of erosion) can be interpreted to cap each parasequence because deep-water facies (i.e., shelf) overlie shallow-water to continental facies. A prominent seismic peak occurs at this contact. Seismic analysis demonstrated that the Walker-Vedder Formation contact is a merged sequence boundary (i.e., lowstand-surface of erosion) and marine-flooding surface (transgressive-surface of erosion) at this location.
 
Figure 24: Interpreted stratigraphic surfaces and facies associations in the cored and logged section of the ARCO Round Mountain No. 1 well through the lower Vedder Formation (Z interval). Prominent stratigraphic breaks can be interpreted as marine-flooding surfaces (i.e., transgressive-surfaces of erosion) or a channel diastem. Seismic peaks occur at each surface, most likely due to the density contrast between the alluvial and shelfal facies.
 
Figure 25: Interpreted stratigraphic surfaces and facies associations in the cored and logged section of the ARCO Round Mountain No. 1 well through the Vedder Formation (A interval). Prominent stratigraphic breaks can be interpreted as marine-flooding surfaces (i.e., transgressive-surfaces of erosion) or channel diastems. Seismic peaks likely occur due to the density contrast between the alluvial and shelfal facies.


Exploration Implications

Multiple Tertiary-age stratigraphic sequences, sensu stricto Mitchum et al. (1977), formed along the eastern San Joaquin Basin, California, margin (Hewlett et al., 2014). Owing to a high sediment-input rate relative to basin subsidence or base-level rise, the transgressive-systems tract in the Zemorrian sequence (Figure 26a) contains multiple reservoirs formed by the repeated progradation and retrogradation of shallow-marine to fluvial depositional systems. Thickness of the transgressive-systems tract increases landward, and varies laterally corresponding to point sources of sediment input from the Sierra Nevada Mountains. Core, wireline-log, and biostratigraphic data corroborate that on this ramp margin, retrogradationally stacked seismic reflections primarily image marine-flooding surfaces at the tops of progradational sandstones (Figure 26b). Progradational sandstones and the upper flooding surface (i.e., maximum-flooding surface) onlap a basinwide lowstand unconformity. Within the transgressive-systems tract, downdip reflector terminations correspond to sandstone pinchouts, whereas updip reflector terminations indicate thinning and pinch-out of onlapping transgressive-marine shales.

 
Figure 26a: Five Tertiary-age stratigraphic sequences and their interpreted systems tracts in the eastern San Joaquin Basin, California (Hewlett et al., 2014). The red arrow denotes the Vedder Sand to Freeman Silt stratigraphic interval.


Figure 26b: Lithologic interpretation of the five Tertiary-age stratigraphic sequences in the eastern San Joaquin Basin, California (Hewlett et al., 2014). The red arrow denotes the Vedder Sand to Freeman Silt stratigraphic interval. Reservoirs formed in sandstones deposited under conditions of shoreline progradation and retrogradation. transgressive-shelf deposits and the highstand-systems tract (i.e., Freeman Silt) form the overlying seals.

Reservoir-prone sandstones occur in all systems tracts (Figure 26b; Hewlett et al., 2014). This example demonstrates how multiple reservoirs formed within the Vedder/Jewett transgressive-systems tract (Figure 26a) because shallow-marine to fluvial depositional systems experiencing high sediment-input rates existed during a basinwide base-level rise. Potential reservoirs occur in alluvial-fan, fluvial, and deltaic/strandplainfacies associations (Figure 27). Trap potential increases toward the top of the transgressive-systems tract due to the increase in seal-forming, fine-grained lithofacies. transgressive-marine mudstones enveloping sandstone-rich parasequences provide vertical seals in addition to the overlying highstand-systems tract (i.e., Freeman Silt) that seals the entire Vedder/Jewett transgressive-systems tract. Prediction of a landward lateral seal is tenuous and stratigraphic pinchouts and/or faults juxtaposing sandstone against mudstone may be required to form traps.

 Figure 27: West-to-east oriented wireline-log cross section intersecting the ARCO Round Mountain No. 1 well (third well from the right). Ten parasequences in the transgressive-systems tract are noted by the upward-coarsening SP log character. parasequences are overlain by flooding surfaces and marine mudstones. The transgressive-systems tract in each well displays a retrogradational stacking pattern, parasequences thin, and mudstone content increases upward. Heavy lines in the ARCO Round Mountain no. 1 well denote cored intervals.


Contributed by James S. Hewlett and Robert S. Tye, PhD., P.G.


Friday, March 20, 2015
Tulsa Web Design    Tulsa Graphic Design     Tulsa SEO    Tulsa Search Engine Optimization